In the world of Forex trading, where fortunes are made and lost in the blink of an eye, having the right tools and strategies at your disposal can make all the difference. One such powerful tool that has gained immense popularity among traders is technical analysis. Harnessing the power of technical analysis can provide traders with crucial insights into market trends, price movements, and potential entry and exit points. In this comprehensive guide, we will delve into the intricacies of technical analysis, exploring how it works, the key principles behind it, and how traders can leverage it to unlock the potential for profitable trades.
Understanding Technical Analysis: The Foundation of Forex Trading
At its core, technical analysis is a method of evaluating securities by analyzing statistics generated by market activity, such as historical prices and volumes. Unlike fundamental analysis, which focuses on factors like economic indicators, company financials, and industry trends, technical analysis is solely concerned with price movements and patterns. The underlying premise of technical analysis is that historical price data can provide valuable insights into future price movements, allowing traders to make informed decisions based on past market behavior.
By studying charts, graphs, and other technical indicators, traders can identify recurring patterns, trends, and support/resistance levels that can help them predict potential price movements. Technical analysts believe that historical price data reflects all information available in the market and that price movements follow specific patterns that can be identified and used to forecast future trends. Through the application of various technical tools and indicators, traders aim to uncover opportunities for profitable trades and minimize the risks associated with market volatility.
Key Principles of Technical Analysis

1. Market Behavior and Trends
One of the fundamental principles of technical analysis is the recognition of market behavior and trends. Markets tend to move in trends, which can be classified as uptrends, downtrends, or sideways trends. By identifying and following these trends, traders can align their trades with the prevailing market direction, increasing their chances of success. Trend analysis involves studying price charts and patterns to determine the overall direction in which an asset is moving.
2. Support and Resistance Levels
Support and resistance levels are key concepts in technical analysis that play a crucial role in determining entry and exit points for trades. Support levels represent price levels at which a security tends to find buying interest, preventing it from falling further.

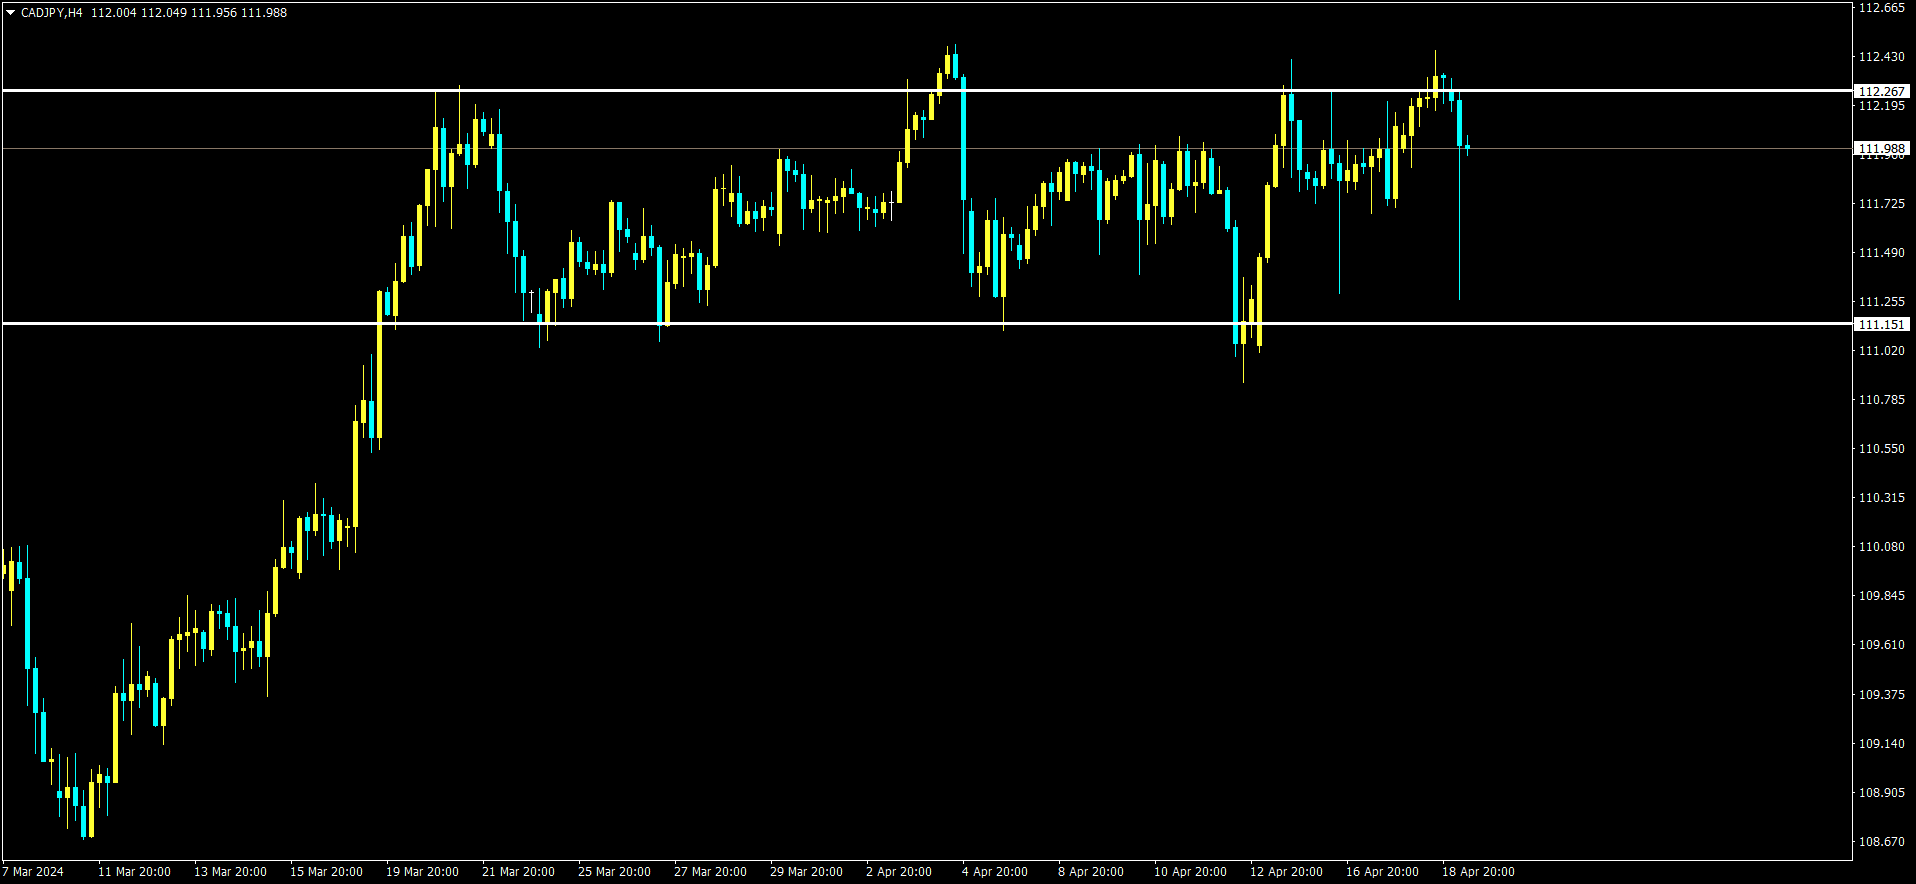
CADJPY is moving in box pattern and market has fallen from resistance area of the pattern.
Resistance levels, on the other hand, are price levels at which selling pressure tends to emerge, preventing the security from rising higher. By identifying these levels on a price chart, traders can anticipate potential price reversals and adjust their trading strategies accordingly.
3. Technical Indicators and Oscillators
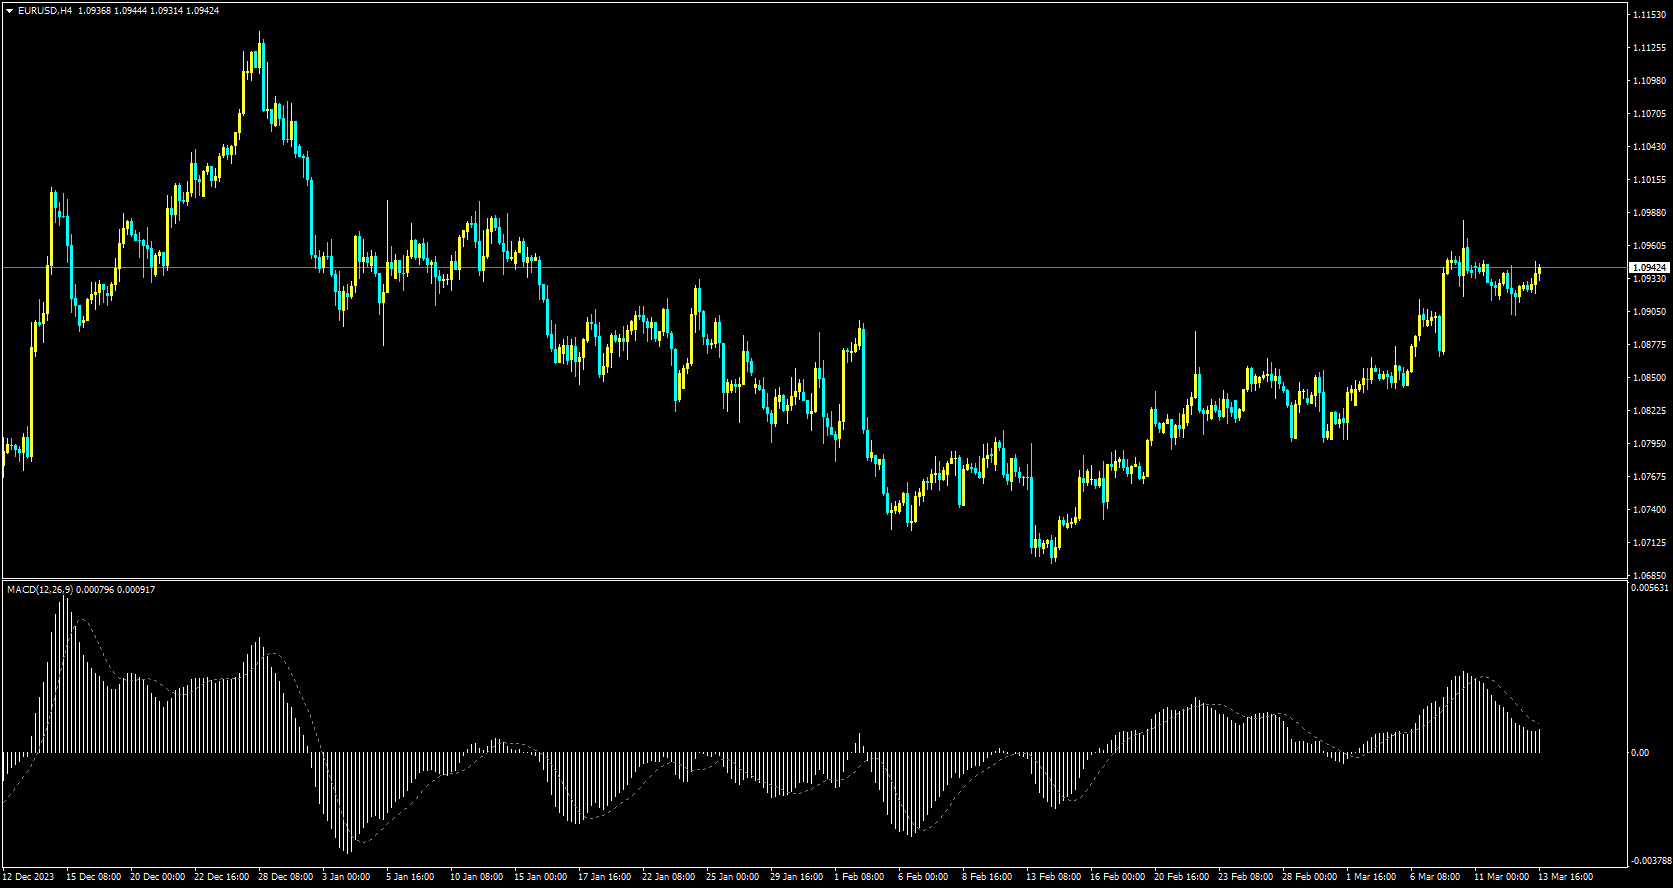
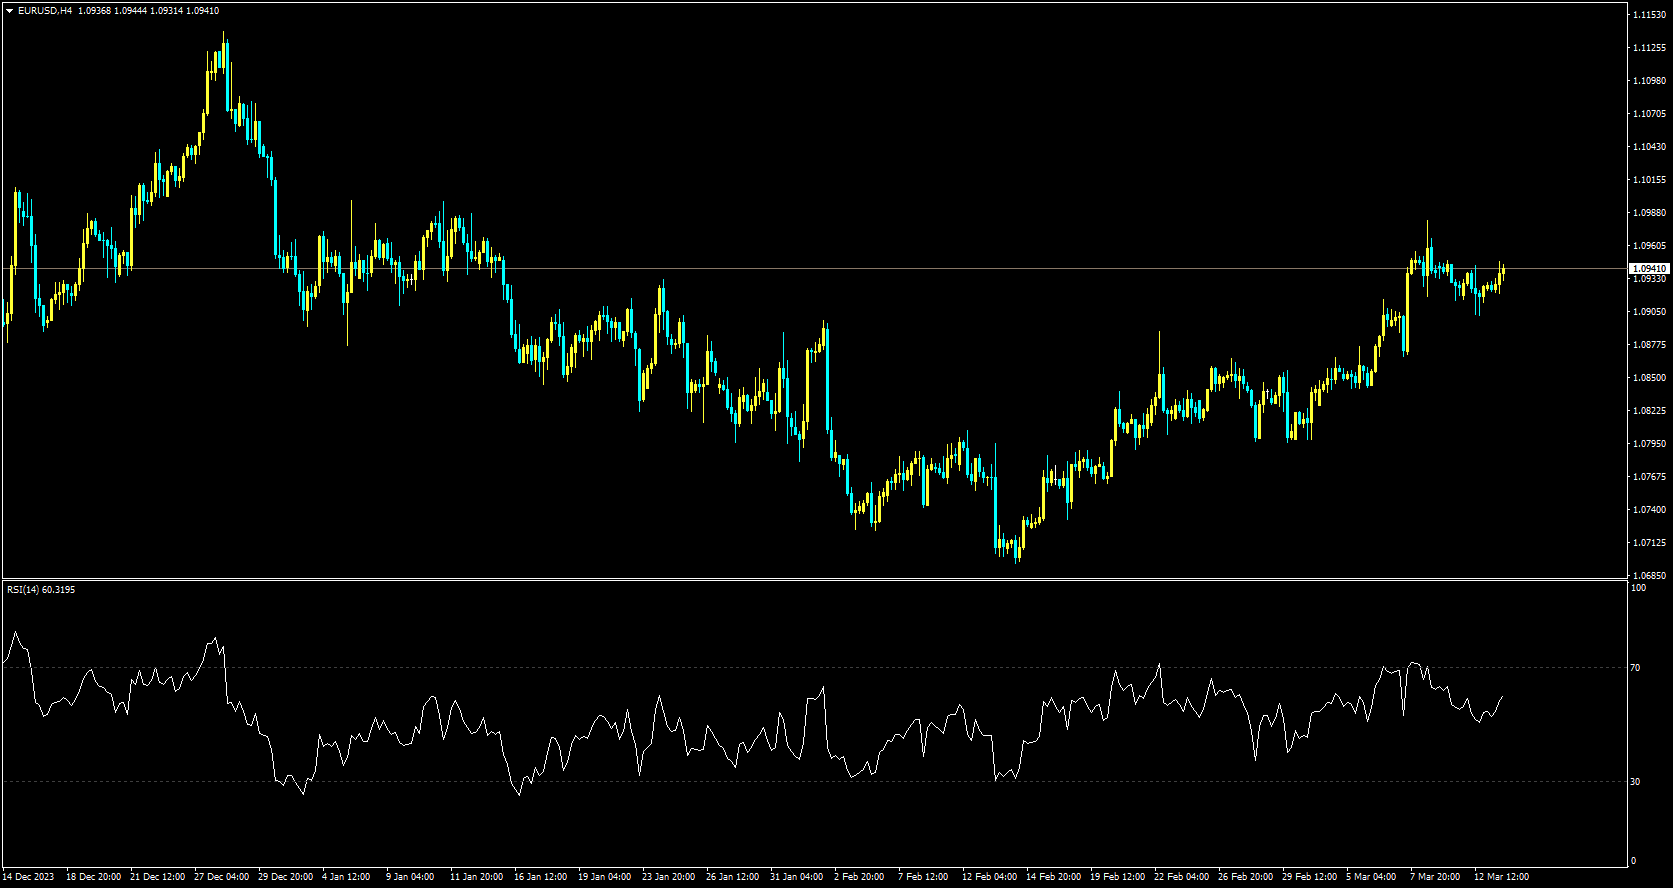
Technical indicators and oscillators are essential tools used by traders to analyze market data and generate trading signals. These indicators are mathematical calculations based on historical price data and can provide insights into market momentum, volatility, and trend strength. Popular technical indicators include moving averages, Relative Strength Index (RSI), and MACD (Moving Average Convergence Divergence).

By incorporating these indicators into their trading strategies, traders can gain a deeper understanding of market conditions and make more informed decisions.
Leveraging Technical Analysis for Winning Signals

1. Identifying Chart Patterns
Chart patterns are visual representations of price movements that can help traders predict future market behavior. Common chart patterns include head and shoulders, double tops and bottoms, triangles, and flags. By recognizing these patterns on price charts, traders can anticipate potential price movements and adjust their trading positions accordingly. Chart patterns are valuable tools for identifying trend reversals, breakouts, and consolidation phases in the market.
2. Using Moving Averages
Moving averages are widely used technical indicators that smooth out price data to identify trends over a specific period. By plotting different moving averages on a price chart, traders can determine the direction of the trend and potential entry and exit points. The crossover of short-term and long-term moving averages can signal trend reversals, while the slope of moving averages can indicate the strength of the trend. Moving averages are versatile tools that can help traders filter out market noise and focus on significant price movements.
3. Applying Fibonacci Retracement Levels
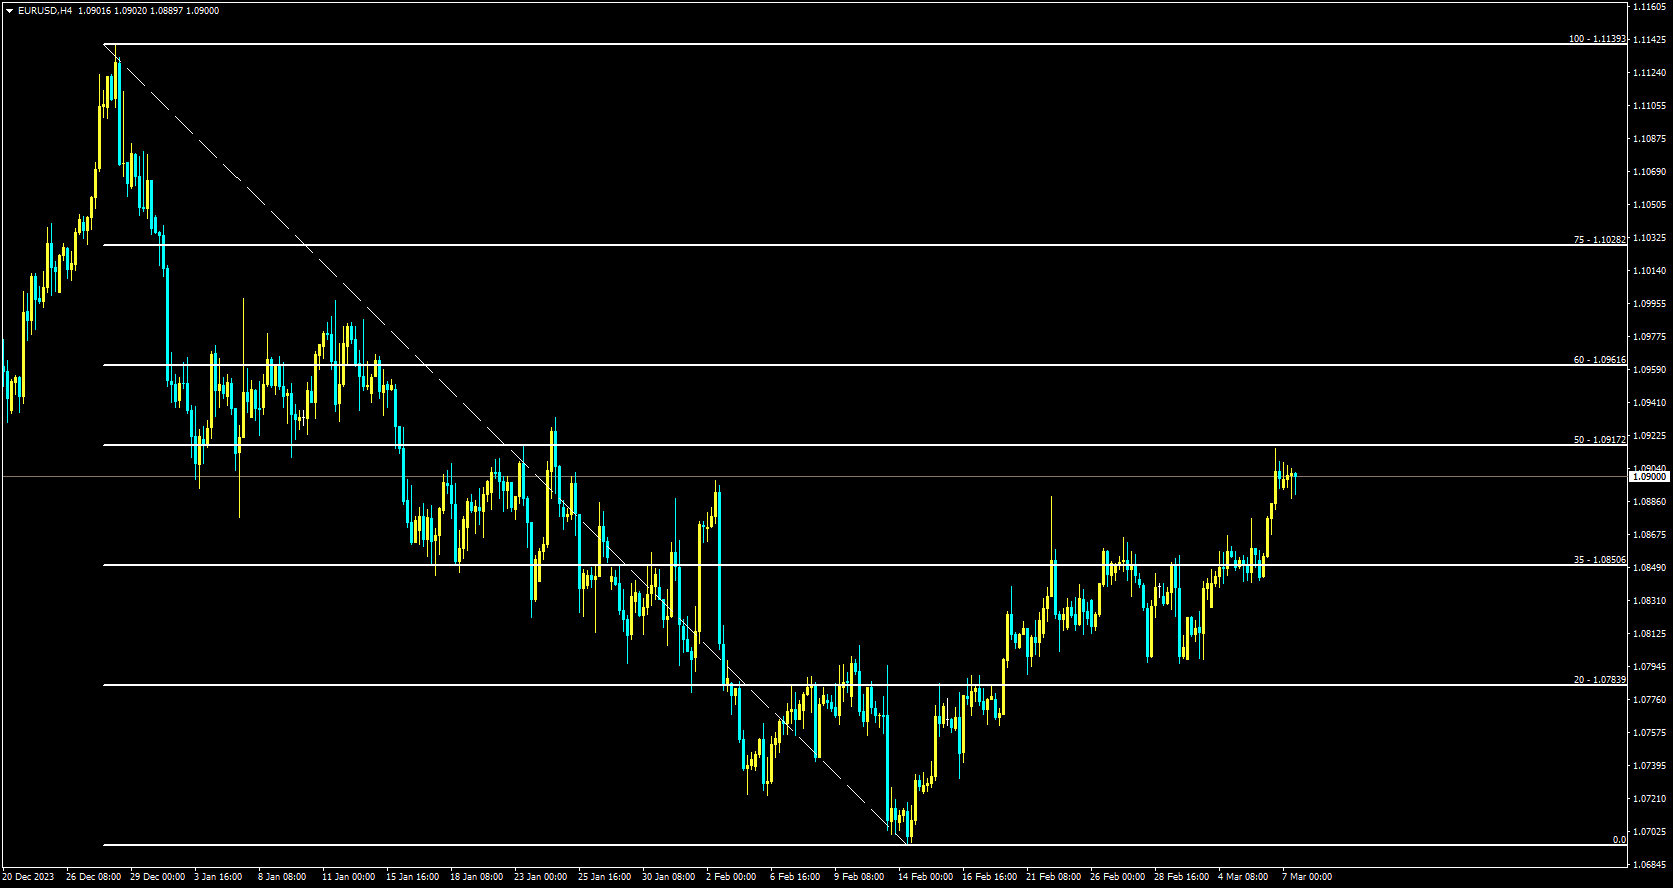
Fibonacci retracement levels are based on the mathematical sequence discovered by Leonardo Fibonacci and are used by traders to identify potential support and resistance levels in a market. By plotting Fibonacci retracement levels on a price chart, traders can anticipate price reversals at key Fibonacci ratios, such as 23.6%, 38.2%, 50%, 61.8%, and 100%.

These levels act as price zones where traders can look for potential entry or exit points based on the market’s reaction. Fibonacci retracement levels are valuable tools for identifying price retracements within a broader trend.
Conclusion
In conclusion, technical analysis is a powerful tool that can help traders unlock the potential for profitable trades in the Forex market. By understanding the key principles of technical analysis, identifying chart patterns, using technical indicators, and applying Fibonacci retracement levels, traders can gain valuable insights into market trends and price movements. Whether you are a novice trader looking to improve your trading skills or an experienced investor seeking to enhance your trading strategies, incorporating technical analysis into your trading toolkit can provide you with a competitive edge in the dynamic world of Forex trading.
Frequently Asked Questions (FAQs)

1. What is the difference between technical analysis and fundamental analysis in Forex trading?
While technical analysis focuses on price movements and historical data to predict future trends, fundamental analysis examines economic indicators, company financials, and geopolitical events to assess the intrinsic value of a currency. Both approaches have their strengths and weaknesses, and many traders use a combination of both methods to make informed trading decisions.
2. How can I learn more about technical analysis and improve my trading skills?
There are numerous resources available online, such as educational websites, trading forums, and online courses, where you can learn more about technical analysis and trading strategies. Practice trading on demo accounts, attend webinars and workshops, and stay updated on market news to enhance your understanding of technical analysis and its applications in Forex trading.
3. Are there any risks involved in relying solely on technical analysis for trading decisions?
While technical analysis can provide valuable insights into market trends and price movements, it is not foolproof and does not guarantee success in trading. Market conditions can change rapidly, and unexpected events can impact price movements, leading to losses for traders. It is essential to use technical analysis as a tool in conjunction with risk management strategies and sound trading practices to mitigate potential risks.
4. How can I incorporate technical analysis into my trading routine effectively?
To incorporate technical analysis into your trading routine effectively, start by familiarizing yourself with key technical indicators, chart patterns, and trend analysis techniques.

Develop a trading plan based on your risk tolerance, financial goals, and time horizon, and consistently analyze price charts to identify potential trading opportunities. Practice discipline, patience, and emotional control in your trading decisions to maximize the benefits of technical analysis.
5. Can beginners benefit from using technical analysis in Forex trading?
Yes, beginners can benefit from using technical analysis in Forex trading as it provides a systematic approach to analyzing price movements and making informed trading decisions. By learning the basics of technical analysis and practicing on demo accounts, beginners can develop the skills and confidence needed to navigate the complexities of the Forex market and improve their trading performance over time.


