Forex trading, the world’s largest and most liquid financial market, offers traders numerous opportunities to profit from currency price movements. In the quest for consistent gains, traders employ various strategies and tools. One of the most versatile and powerful tools in a forex trader’s arsenal is the triangle pattern. These patterns indicate periods of consolidation and indecision in the market, often preceding significant price movements.
In this comprehensive guide, we will delve deep into the world of forex triangle patterns, exploring different types of triangles, how to identify them, and effective strategies for trading them. By the end of this article, you’ll have a solid understanding of triangle patterns and how to integrate them into your forex trading strategy.
1) Understanding Triangle Patterns
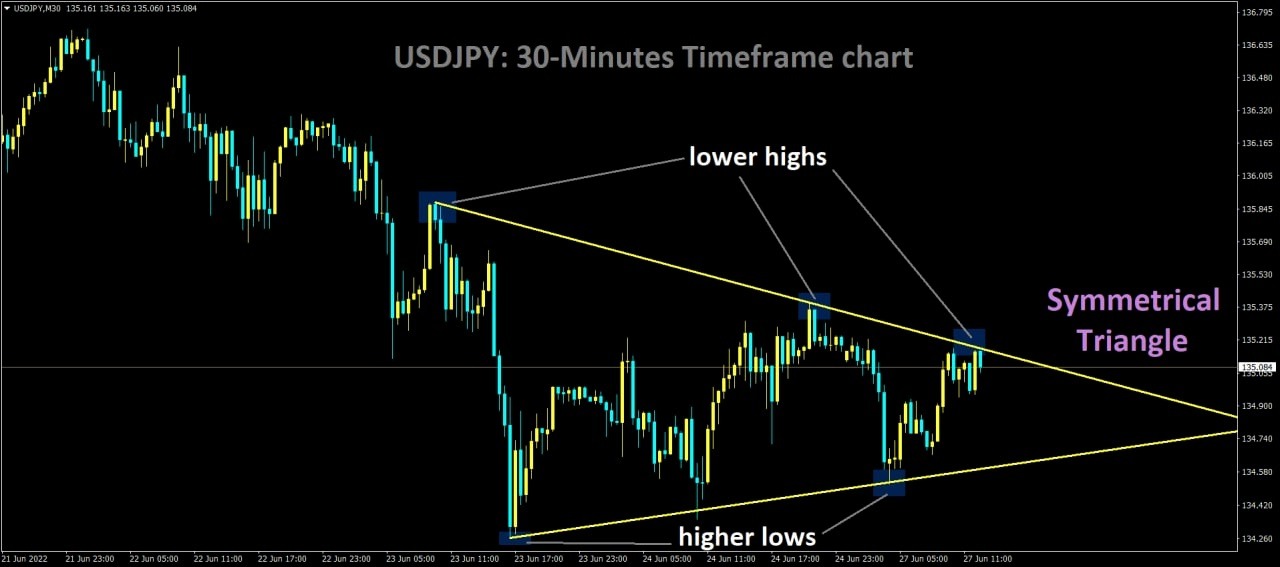
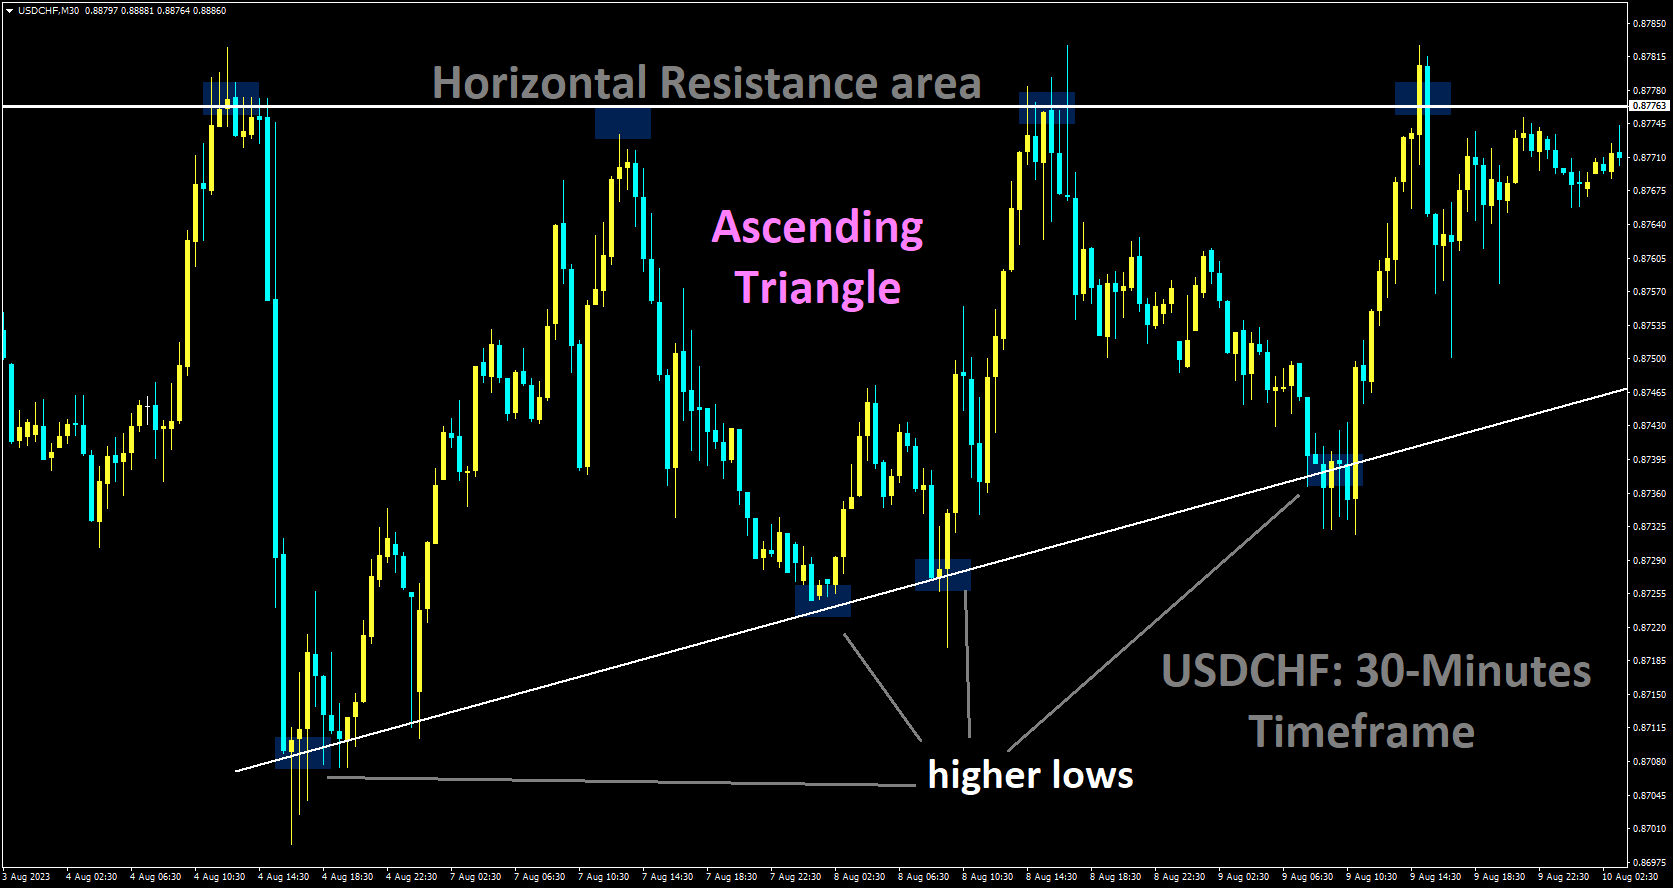
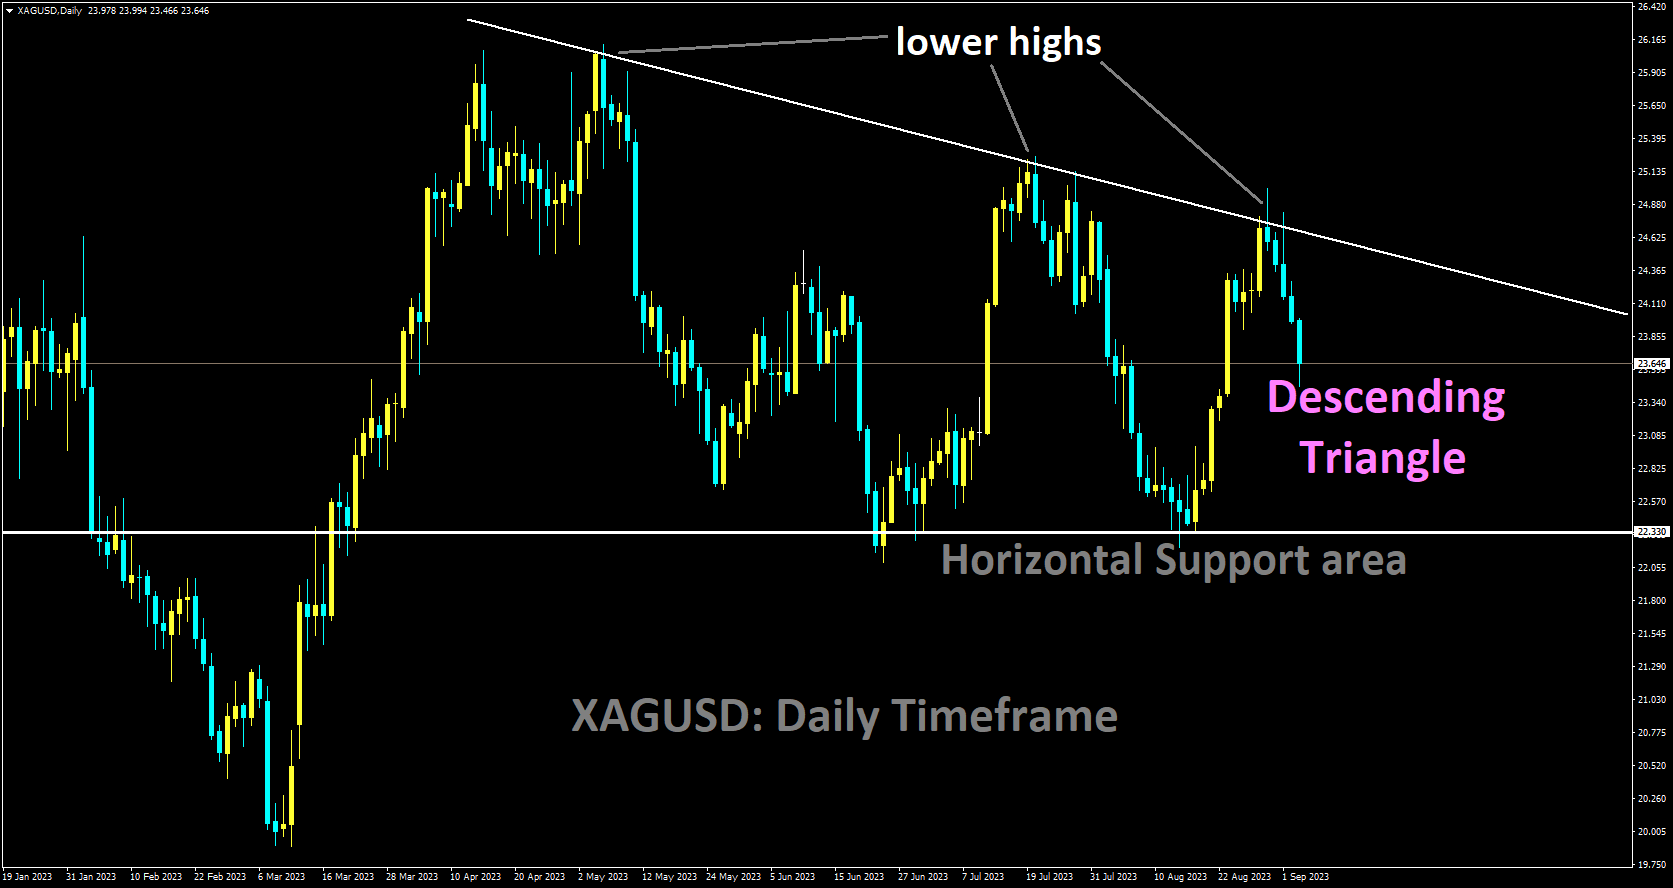
Triangle patterns are an essential component of technical analysis in forex trading. These patterns form when the price of a currency pair narrows into a converging range, shaping a distinct triangular formation on a price chart. Triangle patterns suggest a period of equilibrium in the market, where buyers and sellers are evenly matched, leading to reduced volatility and decreasing trading volumes.
There are three primary types of triangle patterns:
Symmetrical Triangle: This pattern takes shape when the highs and lows of the price action converge toward each other, forming a symmetrical triangle. Symmetrical triangles indicate a state of equilibrium where neither bulls nor bears have a clear advantage. They signal a period of uncertainty and are typically considered continuation patterns.

Ascending Triangle: In an ascending triangle, the price forms a series of higher lows while the upper boundary remains relatively flat, creating an upward-sloping triangle. This pattern suggests that buyers are gaining strength, and a breakout to the upside is anticipated. Ascending triangles are considered bullish patterns.

Descending Triangle: Conversely, the descending triangle has a flat lower boundary and a series of lower highs, indicating that sellers may be gaining control. This pattern often foreshadows a breakdown to the downside. Descending triangles are considered bearish patterns.
 2) Identifying Triangle Patterns
Recognizing triangle patterns on forex charts is a crucial skill for traders. To identify them effectively, follow these steps:
2.1. Select the Right Timeframe
Choose a timeframe that aligns with your trading strategy. Shorter timeframes (e.g., 15-minute or 1-hour) may reveal smaller, more frequent triangles, while longer timeframes (e.g., daily or weekly) can expose larger, more significant patterns. The choice of timeframe depends on your trading style and objectives.
2.2. Draw Trendlines
To identify a triangle pattern, begin by drawing trendlines connecting the series of highs and lows:
For a symmetrical triangle, draw both upper and lower trendlines parallel to each other.
For an ascending triangle, one trendline should be horizontal (the upper boundary), while the other slopes upward, connecting the higher lows.
For a descending triangle, one trendline should be horizontal (the lower boundary), while the other slopes downward, connecting the lower highs.

Creating these trendlines helps visualize the triangular formation and determine its type.
2.3. Watch for Converging Lines
As the price approaches the apex (the point where the trendlines converge), pay close attention. This is a pivotal moment, as it often signifies an impending breakout. A breakout occurs when the price decisively moves above or below the triangle’s boundaries, indicating a potential trend reversal or continuation.
3) Trading Triangle Patterns
Now that you can identify triangle patterns let’s explore various trading strategies to harness their potential:
3.1. Wait for a Breakout

Breakout
Many traders prefer to wait for a breakout from the triangle pattern before entering a trade. A breakout occurs when the price decisively moves above or below the triangle’s boundaries, signifying a potential shift in market sentiment and a probable trend continuation or reversal. The direction of the breakout often dictates the trade’s position – long (buy) for a bullish breakout and short (sell) for a bearish breakout.
Bullish Breakout: When the price breaches the upper trendline of a triangle pattern, it suggests that buyers have gained the upper hand. Traders often initiate long positions, placing stop-loss orders below the breakout point and setting profit targets based on technical or fundamental analysis.
Bearish Breakout: Conversely, when the price breaks below the lower trendline of a triangle, it implies that sellers are gaining control. Traders may consider shorting the currency pair, placing stop-loss orders above the breakout point, and setting profit targets based on their analysis.
3.2. Use Additional Indicators
While triangle patterns can provide valuable insights, they are most effective when used in conjunction with other technical indicators. Incorporate indicators such as moving averages, RSI (Relative Strength Index), MACD (Moving Average Convergence Divergence), or stochastic oscillators to confirm the direction of the breakout. The convergence of multiple indicators can increase the reliability of your trading signals.
For instance, if you identify a bullish breakout from an ascending triangle and the RSI indicates overbought conditions, you may exercise caution and look for additional confirmation before entering a long trade.
3.3. Set Stop-Loss and Take-Profit Levels
Risk management is paramount in forex trading. Always use stop-loss orders to limit potential losses and take-profit orders to secure profits. These levels should be determined based on your risk tolerance, the pattern’s volatility, and the expected price movement.

Stop-Loss Orders: Place stop-loss orders below the breakout point for bullish trades and above the breakout point for bearish trades. These orders act as safety nets, automatically closing the trade if the market moves against you, limiting potential losses.
Take-Profit Orders: Set take-profit orders based on your analysis. Consider using support and resistance levels, Fibonacci retracement levels, or previous price swings as reference points for profit targets. It’s essential to maintain a favorable risk-reward ratio.
3.4. Consider Risk-Reward Ratio
Before entering a trade, carefully assess the risk-reward ratio. A favorable risk-reward ratio ensures that your potential reward significantly outweighs your risk, helping you make informed trading decisions. A commonly recommended ratio is 1:2 or higher, which means that your potential profit should be at least twice the size of your potential loss.
By maintaining a healthy risk-reward ratio, you can protect your capital and achieve consistent profitability over the long term.
3.5. Practice Patience and Discipline
Emotional discipline is critical in forex trading. Stick to your trading plan and avoid impulsive decisions based on fear or greed. Trading can be emotionally challenging, especially when facing market volatility, but maintaining a disciplined approach is key to success. Consider using a trading journal to document your trades, emotions, and strategies to refine your trading skills over time.
4) Advanced Strategies for Triangle Trading

For experienced traders looking to further enhance their triangle pattern trading, consider the following advanced strategies:
4.1. Multiple Timeframe Analysis
Performing multiple timeframe analysis can provide a broader perspective on triangle patterns. After identifying a triangle on a higher timeframe (e.g., daily or weekly), switch to lower timeframes (e.g., 4-hour or 1-hour) to fine-tune your entry and exit points. This approach can help you align your trades with the overall trend while taking advantage of short-term opportunities.
4.2. Combining Fundamental Analysis
Integrate fundamental analysis with technical analysis to make more informed trading decisions. Keep an eye on economic news, central bank announcements, geopolitical events, and economic indicators that can impact the currency pair you’re trading. Fundamental analysis can help you gauge the broader market sentiment and support your technical analysis findings.
4.3. Continuation Patterns
While this guide focuses on triangle patterns as potential reversal patterns, it’s worth noting that triangles can also act as continuation patterns. In such cases, a breakout from the triangle pattern may signal a resumption of the existing trend rather than a reversal. Continuation patterns can offer traders opportunities to ride established trends and maximize profits.
Conclusion
In conclusion, mastering the art of trading forex triangle patterns requires a combination of technical analysis skills, risk management, and emotional discipline. These patterns provide valuable insights into market sentiment and potential price movements, making them a valuable tool for traders.
To succeed in trading triangle patterns, remember these key points:
Understand the different types of triangle patterns: symmetrical, ascending, and descending.
Learn how to identify these patterns by drawing trendlines and watching for converging lines.
Develop a clear trading strategy, including entry and exit points, stop-loss and take-profit levels, and risk management measures.
Combine triangle pattern analysis with other technical indicators and consider multiple timeframes for a comprehensive trading approach.
Continuously practice patience and discipline, as emotional control is vital in forex trading.
Triangle patterns can significantly enhance your trading strategy, but success requires dedication and continuous learning. As you gain experience, you’ll become better at recognizing and trading these patterns effectively, ultimately increasing your chances of success in the dynamic world of forex trading.
❌ Stop trying to catch every 📊 movement in the market 😎 Look for the best entry – Get more best entry signals at premium or VIP plan
🎁 60% OFFER for Signals 😍 GOING TO END – Get now: forexfib.com/offer/


